As part of our Early America co-op series this month, we've been collecting food items for The Sharing Center. During this week's class, we inventoried the food collected during our food drive and charted the donations on a bar graph.
Since it's been a while since we used this fun
graphing site, we decided to take a look at how the same data would look in different graph forms. Here are our results:
Bar graph:
Pie Chart: Line Graph:
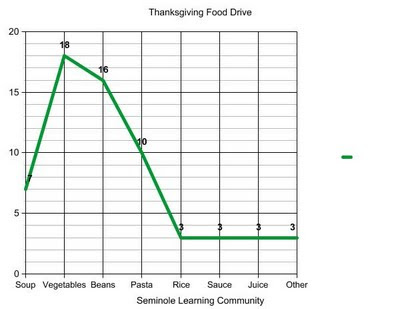 Area Graph:


No comments:
Post a Comment