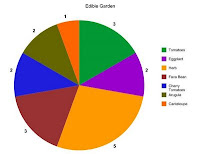
I found a great website that allows you to create a variety of charts and graphs you can save or e-mail to others. I've been wanting to teach Noah about charts and graphs, so after tending to the garden this morning, we had a little lesson using our plants as the data.
- Our Garden - This pie chart includes both edible and non-edible plants with each herb plant listed seperately.
- Edible Garden - This pie chart shows only our edible plants (herbs still listed individually).
- Edible Garden 2 - This pie chart (shown above) shows our edible plants with the herbs listed as a group.

- Red & Green Tomatoes - This bar graph (shown to the left) is helping us track our tomato growth.
We'll count the number of red and green tomatoes on Mondays and Thursdays over the next two weeks. It's not all that exciting right now since they're all green and we've only counted on two days, but I'm excited to see what it will look like as they grow and ripen.


No comments:
Post a Comment